Navigating the Landscape of Information: A Series Introduction
Mathias Torp, Innovation Engineer
Summary
In an era where data surrounds us like an infinite ocean, a visionary series emerges, guiding us on a transformative journey across this vast digital landscape. Here, the sharp analytics of Artificial Intelligence (AI) merge with the nuanced cognition of the human mind, crafting a new way to navigate the intricate world of information.
Imagine standing at the edge of a vast terrain, where mountains, valleys, and rivers are not made of earth and water, but of data. This is the Information Landscape, a revolutionary concept where data ceases to be mere numbers and becomes a living, breathing terrain. Hills rise and fall, echoing the ebb and flow of economic markets or social trends. This landscape is not just for the eyes; it's for the mind, making data exploration as intuitive as a stroll through familiar paths.
At the heart of this landscape is AI, a master craftsman, meticulously sculpting complex datasets into forms and patterns resonating with our inborn visual instincts. It democratizes data, extending the power of intricate analysis from the hands of few experts to the minds of many, inviting everyone to partake in the dialogue of data.
As researchers embark on this journey, they find themselves in a dynamic world. The Landscape of Research is ever-changing, pulsating with the rhythm of new discoveries and insights. Peaks signify burgeoning fields; plateaus, well-trodden knowledge. It’s a living map, charting the course of human intellect and curiosity.
Visual storytelling takes center stage, transforming abstract concepts into tangible forms. Here, AI is not just a tool but a guide, leading us through the valleys of complexity with the ease of a seasoned navigator. It’s a landscape that responds, evolves, and reveals hidden connections, illuminating the paths of understanding that were once shrouded in the mist of data overload.
In this realm, the collaboration between human and AI is not just a partnership; it's a symbiosis. It’s about breaking down the walls of complexity, making the profound depths of data accessible to all. This democratization of data interpretation is not just about making sense of numbers; it’s about weaving these numbers into the fabric of everyday decision-making, across businesses, research, and public policy.
This journey through the Landscape of Information is also a quest for sustainability in the digital world. Here, AI-generated data is treated with the same respect as the natural world, emphasizing ethical sourcing, privacy, and the lifecycle of information. It’s about nurturing a data ecosystem that is as diverse and resilient as any found in nature.
And as we traverse this landscape, we realize it's more than a journey through data; it's a journey of human intuition and abstract thinking. It’s about using the visual language of landscapes to bridge islands of knowledge, fostering interdisciplinary collaboration and insights.
This series is an invitation to view data not as a distant, untamed wilderness but as a familiar, navigable world. It’s a call to embark on this journey, to explore, understand, and interact with the universe of information like never before. This is not just the future of data interpretation; it’s a new chapter in the story of human understanding, a narrative where every twist and turn brings us closer to the essence of knowledge itself.
I. Introduction
In this introduction to a series on the topic, we embark on a journey to bridge two distinct yet complementary worlds: the nuanced cognitive strengths of the human mind and the analytical prowess of artificial intelligence. This fusion is more than a mere combination of forces; it's a redefinition of how we interact with and understand the intricate web of data that surrounds us. We are stepping away from viewing data as a static array of numbers, confined within the rigid bounds of spreadsheets and charts. Instead, we envision it as a dynamic, evolving entity - a living landscape that breathes, responds, and grows, inviting an interactive, human-centric exploration.
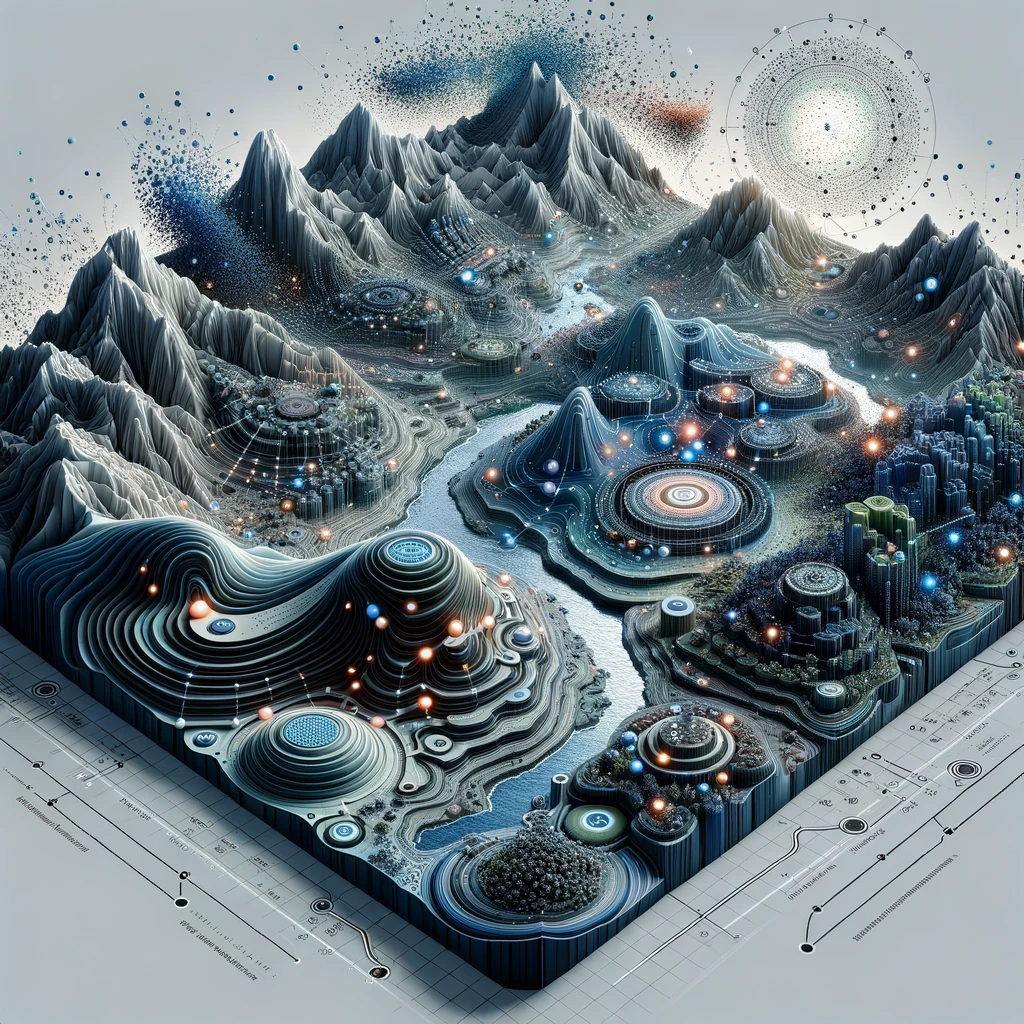
Our approach is rooted in the belief that data exploration should be intuitive, leveraging the innate knowledge and understanding that everyone possesses. This series aims to illuminate the path from rigid numerical analysis to a more natural, intuitive form of exploration. We're transforming the cold, hard figures of raw data into a rich narrative landscape, enabling a story-like journey through information, where each twist and turn reveals new insights and understandings unique to every user.
The paradigm shift we propose is significant. We're charting a course away from the traditional, often inaccessible models of data analysis, steering towards a realm where data becomes a partner in dialogue. This partnership aids in decision-making and sparks innovation, making complex insights accessible and engaging to a broader audience. In this new world, AI plays a crucial role, distilling complex data into patterns and shapes that resonate with our innate ability to recognize and process visual information, making the intricate simple and the complex accessible.
This shift also signifies a democratization of data, moving away from a model where complex insights are the exclusive domain of those with technical expertise. Instead, we're opening up these insights to a wider audience, fostering greater engagement with the information that shapes our world. In doing so, we propose that data should and can resonate with our natural cognitive processes. The series explores how AI can amplify and extend our inherent pattern-recognition capabilities, stepping in not to replace human thought but to enhance it.
As we set the stage for this series, we invite readers to join us in reimagining their relationship with data. No longer should data be viewed as a distant, foreign element. Instead, we see it as a familiar landscape, ripe for exploration with the human mind's innate tools. This journey into a new paradigm of data interaction promises to make the vast complexities of information sets not only accessible but engaging, transforming the way we navigate and understand the world of data.
II. The Concept of Information Landscapes
In this section, we delve into the innovative concept of visualizing data as landscapes, a transformative step in the way we perceive and interact with information. Moving beyond the traditional, flat graphs and charts, which often fail to inspire or engage, we reimagine data as topographies and terrains. In this new visualization, the ebb and flow of data are represented through the rise and fall of hills and valleys. Imagine a landscape where a rising hill depicts an upsurge in economic markets, while a deep valley might symbolize a decline in social engagement metrics. This approach is not merely metaphorical; it's a practical tool that leverages our innate ability to navigate and understand physical spaces. Data becomes a terrain that one can 'walk through' and 'feel', providing an understanding that is both visceral and intellectual.
Each geographical feature in this landscape of data is imbued with meaning. A mountain range, for instance, could signify a significant trend, with each peak and trough representing a data point within that trend. The interconnected pathways that wind through these features reveal underlying relationships and patterns, offering multi-dimensional insights that flat graphs simply cannot provide. These landscapes are living entities, constantly evolving as new data flows in, ensuring that the visualization is always current and reflective of the latest information, much like a living ecosystem adapts and evolves with changing seasons.
In shaping these information landscapes, artificial intelligence emerges as a master craftsman. It meticulously sculpts the vast array of data into comprehensible, visually engaging landscapes. AI processes, analyzes, and translates complex datasets into visual forms, employing algorithms that mimic and enhance human cognitive processes. This personalized approach to data visualization ensures that the landscape is tailored to the needs and interests of each user. For example, a financial analyst might be presented with a landscape highlighting economic indicators, while a public health official would see a terrain shaped by health statistics.
AI goes beyond creating static maps; it provides an interactive cartography tool, allowing users to query, manipulate, and explore the data landscape. This interactivity is akin to a GPS system, offering real-time guidance and insights based on the user's current location and destination within the data terrain. As users venture into unfamiliar areas of the landscape, AI acts as a guide, illuminating hidden connections and providing explanations, making previously obscure information understandable.
Perhaps most importantly, this approach to data visualization democratizes the power of data analysis. By translating complex data into intuitive landscapes, AI ensures that data analysis is not confined to the realm of data scientists but is accessible to anyone with curiosity. This accessibility opens up the treasure trove of data to a broader audience, fostering a more informed and empowered society.
Through the concept of information landscapes, we present a revolutionary step in data visualization. AI plays a pivotal role in translating raw data into intuitive, navigable terrains, transforming data into a dynamic entity that can be interacted with, explored, and understood on a deeply human level. This approach not only makes data more accessible but also redefines it as a living, breathing landscape of knowledge.
III. The Landscape of Research
This section of our series unveils a revolutionary approach to understanding major research trends through the lens of intuitive and dynamic data visualization. This concept takes us into the realm of mapping the intellectual terrain, where the vast expanse of research data is transformed into a panoramic view that reveals the contours of current scholarly activity. It’s a landscape marked by visual cues and patterns, offering immediate insights into which research areas are thriving with activity and which remain underexplored.
This landscape approach is particularly adept at detecting the pulse of progress within the academic world. By translating research outputs, citations, collaborations, and funding into elevations and depressions within the landscape, we can discern burgeoning fields represented by peaks and established areas of knowledge indicated by plateaus. This visual representation of data does more than just inform; it tells a story. The journey from one research area to another, the clustering of related disciplines, and the emergence of new fields of inquiry unfold like chapters in an ongoing saga of human discovery. Unlike static representations, this landscape is dynamic and real-time, with new studies, theories, or technologies causing shifts that ripple across the terrain, reflecting the evolving nature of knowledge and the interconnectedness of various research domains.
Beyond mere observation, the Landscape of Research requires a recalibration of intuition in the world of scholarly inquiry. In a domain where information is constantly evolving, researchers need to fine-tune their intuition to identify and respond to emerging trends and shifts. In this context, Artificial Intelligence acts as a critical cognitive extension, highlighting unfamiliar or unexpected elements and prompting deeper investigation. This AI-driven recalibration facilitates a more nuanced understanding of the research environment.
The visualization tools embedded within the landscape assist researchers in maintaining an adaptive focus. As the landscape of data evolves, with new points emerging and old ones receding, the landscape guides researchers, ensuring that their attention remains on the most relevant and impactful developments. Engaging with this landscape over time, researchers develop intuitive heuristics, allowing for more instinctive navigation of their field. This constantly evolving landscape ensures that researchers are always aligned with the latest knowledge and insights.
Moreover, this landscape serves as an immersive learning environment, transforming the process of discovery into a journey through data. It invites playful exploration and fosters a sense of wonder and curiosity, which lie at the heart of scientific inquiry. This approach is not just about understanding data; it's about experiencing it, making the Landscape of Research a powerful tool in the arsenal of modern academia.
By expanding on the concept of the Landscape of Research, we aim to illuminate how visualizing data as an intuitive, navigable landscape can greatly enhance our understanding of major research trends. It underscores the necessity of recalibrating our intuition and approach to effectively navigate the vast and ever-expanding frontiers of human knowledge.
IV. The Visualization
Now we delve into the intricate process of transforming abstract data into a tangible, navigable landscape. This transformative journey begins with the embedding of each piece of research, data point, and concept into a high-dimensional space. Here, the position and relationships of these elements are determined by their inherent characteristics and interconnections, effectively translating the abstract into the tangible.
As we venture into the realm of this three-dimensional landscape, embedded data points begin to form recognizable patterns. These patterns, emerging as mountains, valleys, or rivers, offer intuitive navigation cues, mirroring the inherent structure and relationships within the data. This ability to discern patterns is pivotal for navigating through the landscape of information. It allows users to intuitively grasp the underlying structure of complex data sets.
The art of creating these patterns lies in the technique of dimensionality reduction. This process involves distilling multifaceted, complex information into a visual format that is both comprehensive and perceptually manageable. Maintaining the depth and integrity of the information while rendering it in a form that is easily navigable is a delicate balance, one that is masterfully achieved through advanced algorithms.
AI plays a crucial role in sculpting this data terrain. It ensures that significant correlations stand out like peaks in a mountain range, while outliers and anomalies appear as distinct islands. These visual cues are not merely aesthetic; they guide the observer’s understanding and interpretation of the data’s narrative, revealing stories hidden within numbers and figures.
The visualization landscape is not meant to be a passive viewing experience. It invites active interaction and exploration. Users can navigate through this landscape, zooming in for a detailed examination of specific data points or zooming out for a broader overview. This interaction is akin to a hiker navigating a valley or a climber charting a path up a mountain, with each decision and turn offering new perspectives and insights.
As users traverse this landscape, they are equipped with a suite of tools that enable them to delve deeper, uncovering layers and nuances of information that might not be immediately apparent. This process allows for a detailed exploration of the data, revealing insights and connections that lie beneath the surface.
The dynamic and responsive nature of this landscape means that it changes and adapts as users interact with it. Clicking on a data point can illuminate related information, bringing to light connections and context that enhance understanding. This interactivity transforms the landscape into a platform for discovery, fostering serendipitous insights and encouraging exploration beyond familiar territories, leading to cross-disciplinary discoveries and innovations.
For more complex data sets, often referred to as 'data lakes', the visualization landscape offers a means to navigate these vast reservoirs of information. It enables users to take deep dives into these lakes, surfacing with insights and understandings that would remain hidden in more traditional forms of data analysis.
Overall, the Visualization section of our series underscores the technical sophistication and experiential richness of transforming complex data into an intuitive, interactive landscape. It highlights the pivotal role of AI in crafting this landscape and the various levels on which users can engage with the data, from overarching patterns to the intricate details of individual data points. This approach not only makes the data more accessible but also transforms it into a dynamic, living entity that invites exploration and discovery.
V. Winds of Change
Let's explore the dynamic and ever-evolving nature of the research landscape, highlighting the crucial role of visualization and predictive analytics in navigating this changing terrain. This part of our narrative vividly illustrates how change within the research field is represented through visual metaphors in the landscape. For instance, shifting terrains and evolving weather patterns within the visualization act as symbols for the dynamic nature of research. A previously sunny and stable area in the landscape might suddenly see clouds gathering, hinting at a disruptive technology or a paradigm shift looming on the horizon.
The predictive analytics capabilities of AI play a pivotal role in this changing landscape, functioning like an advanced forecast system. By analyzing historical and current data trends, AI models are capable of predicting future shifts in the research landscape. These predictions help in anticipating where new hills of opportunity might rise or where valleys, indicating areas of decline, may form. This aspect of the visualization is not a static snapshot; rather, it's a living, breathing model that responds in real-time to new inputs of data. As new research findings, publications, or global events unfold, the landscape morphs accordingly, capturing the immediate impact of these developments.
AI also creates predictive pathways within the visualization, offering guidance through potential future scenarios based on current trends. These pathways provide researchers with the insight needed to navigate through possible outcomes, aiding them in making informed decisions about the direction of their future work.
Adapting to a rapidly changing research environment is imperative in a world where knowledge expands at an unprecedented rate. The landscape visualization fosters this agility, providing a broad perspective that helps researchers quickly adapt their focus as new trends and developments emerge. AI acts as a catalyst for this adaptation, offering tools and insights that enable researchers to pivot and evolve their work in response to new data. This leads to a form of collaborative adaptation, where researchers from different disciplines can see how their work intersects, allowing them to join forces and address new challenges or opportunities as they arise.
Engagement with this dynamic landscape educates the intuition of its users, enabling them to sense and respond to changes more acutely. This heightened sensitivity is akin to a seasoned sailor reading the signs of an impending storm, allowing researchers to proactively respond to subtle shifts in their environment. By visualizing these changes and facilitating adaptation, the landscape ensures that the momentum of research is sustained. It supports a fluid transition of ideas and methodologies, helping the research community to stay ahead of the curve in an environment that is continually evolving.
In summary, the "Winds of Change" section underscores the responsive and predictive nature of the research landscape visualization. It highlights how AI and dynamic visual tools not only reflect the current state of research but also equip users to anticipate and adapt to future developments, ensuring that their work remains relevant and vital in a rapidly changing world.
VI. Symbiotic AI Data
We now explore the concept of creating sustainable data ecosystems, where the symbiosis between AI and data plays a pivotal role. At the heart of these ecosystems is the principle that quality is the keystone. AI-generated data must be accurate, relevant, and reflective of real-world complexities. This ensures that the data adds value to the landscape, enriching it with meaningful information rather than cluttering it with noise.
The idea of data reusability and its lifecycle is central to these ecosystems. Much like the circular life processes in nature, data is not meant for single use. AI-generated data is designed with the flexibility to be reused, repurposed, and reinterpreted as the research environment evolves, thus maximizing its value over time. This approach mirrors the sustainable practices of nature, where nothing is wasted, and everything serves a purpose at different stages of the lifecycle.
Ethical considerations are paramount in the harvesting of data, akin to a gardener taking care not to harm the soil. AI systems are finely tuned to respect privacy, consent, and the integrity of information sources. This ethical approach ensures that the data ecosystem remains healthy, trusted, and sustainable.
When considering the impact of AI-generated data, it's crucial to look at the long term. This data is cultivated not just to serve immediate research needs but also to lay the groundwork for future work, contributing to a legacy of knowledge that endures over time.
In fostering symbiotic relationships, AI plays a crucial role in connecting data flora and fauna. Data sets are not isolated entities; they exist in a web of interdependence. AI is instrumental in weaving these strands together, creating a landscape where data from disparate sources coexist and enrich each other. This interconnectedness leads to mutualism in data exchange, much like the ecological mutualism where different species benefit from each other's presence. AI systems are adept at identifying and fostering these beneficial exchanges, creating a cohesive and synergistic research environment.
The diversity of data, representing various disciplines and viewpoints, is celebrated as a strength. It mirrors the biodiversity essential for resilience in natural ecosystems. This diversity acts as a buffer against homogeneity and fosters a robust landscape capable of adapting to change. AI facilitates the cross-pollination of ideas between different data sets, encouraging innovation and the emergence of new insights that may not have been apparent in isolated data.
AI's role extends beyond merely connecting existing data points. It also involves identifying gaps in the landscape where introducing new data could catalyze growth, similar to introducing new species into an ecosystem to promote health and diversity. This approach to cultivating growth ensures that the data landscape is dynamic, evolving, and always conducive to discovery and innovation.
In summary, the "Symbiotic AI Data" section delves into the creation of sustainable data ecosystems, emphasizing the importance of quality, reusability, and ethical practices in AI-generated data. It highlights how AI can foster symbiotic relationships between diverse data sets, creating a rich, interconnected landscape that mirrors the resilience and mutual benefits seen in natural ecosystems. This approach not only enhances the value of the data but also ensures its longevity and relevance in the ever-evolving world of research.
VII. Intuition and Abstract Thinking in Data Navigation
In this section we delve into the transformative power of intuitive visualization in understanding and navigating complex systems, highlighting its role in illuminating cross-domain connections. This approach is grounded in harnessing our innate visual cognition skills to make sense of intricate data systems. By translating abstract concepts and complex relationships into comprehensible visual structures, these intuitive visualizations allow users to grasp complexity in a more natural and immediate way.
The transformation of data into familiar forms like landscapes plays a pivotal role in developing an intuitive understanding of complex systems. This approach enables users to naturally infer relationships and patterns within the data, effectively bypassing the often steep learning curve associated with traditional complex data analysis. As users interact with these data landscapes, they gradually develop an instinctive ability to navigate and interpret complex information systems. This skill acquisition is akin to learning a new language; it might be challenging at first, but it becomes increasingly natural over time.
One of the key advantages of this approach is the simplification of abstract data. By rendering complex information into tangible visual forms, users are able to form mental models of these systems, which they can then manipulate and explore in their minds. This not only makes the data more accessible but also enhances the users' cognitive capacity, enabling them to tackle more complex problems and develop deeper insights than would be possible with conventional data analysis methods.
The intuitive data landscapes also play a crucial role in bridging knowledge islands across various domains and disciplines. By illuminating connections and intersections that were not previously apparent, these landscapes foster interdisciplinary insight and understanding. Researchers and experts from diverse fields are able to identify parallels and intersections between seemingly unrelated areas, leading to innovative approaches and solutions.
These visualizations act as a catalyst for collaboration, bringing together experts from different fields and fostering a shared understanding and appreciation of each other's work. The AI-driven landscapes highlight existing connections and also suggest potential areas for fruitful cross-domain collaboration, particularly valuable in exploring uncharted territories of knowledge.
Moreover, by making complex interrelations accessible, these intuitive landscapes democratize data interpretation. They empower a broad range of individuals, regardless of their background or expertise, to engage with and contribute to interdisciplinary research. This democratization of data interpretation not only broadens the scope of participation in research but also enriches the research itself with diverse perspectives and insights.
In summary, the "Intuition and Abstract Thinking in Data Navigation" section highlights the significant role of intuitive visualization in simplifying and democratizing the interpretation of complex data. It underscores how these visualizations can transform abstract data into a more accessible, engaging, and collaborative format, fostering a deeper interdisciplinary understanding and cooperation.
VIII. Embeddings and Dimensionality
Exploring the vast terrain of data through the lens of embeddings and dimensionality is akin to witnessing the neural activity of a brain or the natural contours of a river or mountain range. As we pose questions and traverse different areas of this information landscape, we see specific regions light up, signaling connections and relationships to the provided information. This illumination is reminiscent of seeing constellations emerge in the night sky; each cluster of stars tells a story, unfolding as the celestial sphere rotates, revealing new patterns and tales.
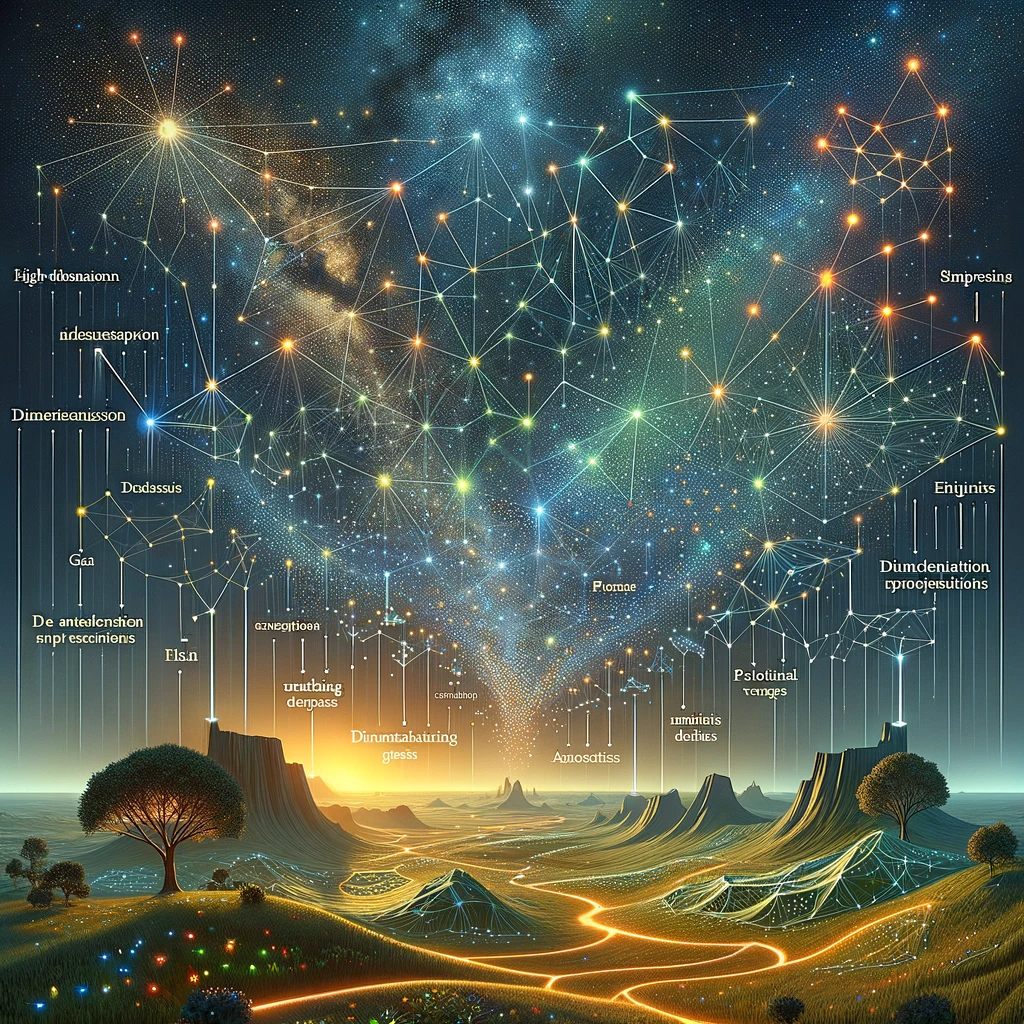
The process of embeddings is our means of translating the complex, high-dimensional data into these visual phenomena. It brings clarity to the intricate web of information, distilling vast arrays of data points into simpler representations while meticulously preserving their intrinsic relationships and patterns. The essence of data is thus captured, identifying and accentuating key features and connections, much like how the changing sky reveals different constellations throughout the seasons.
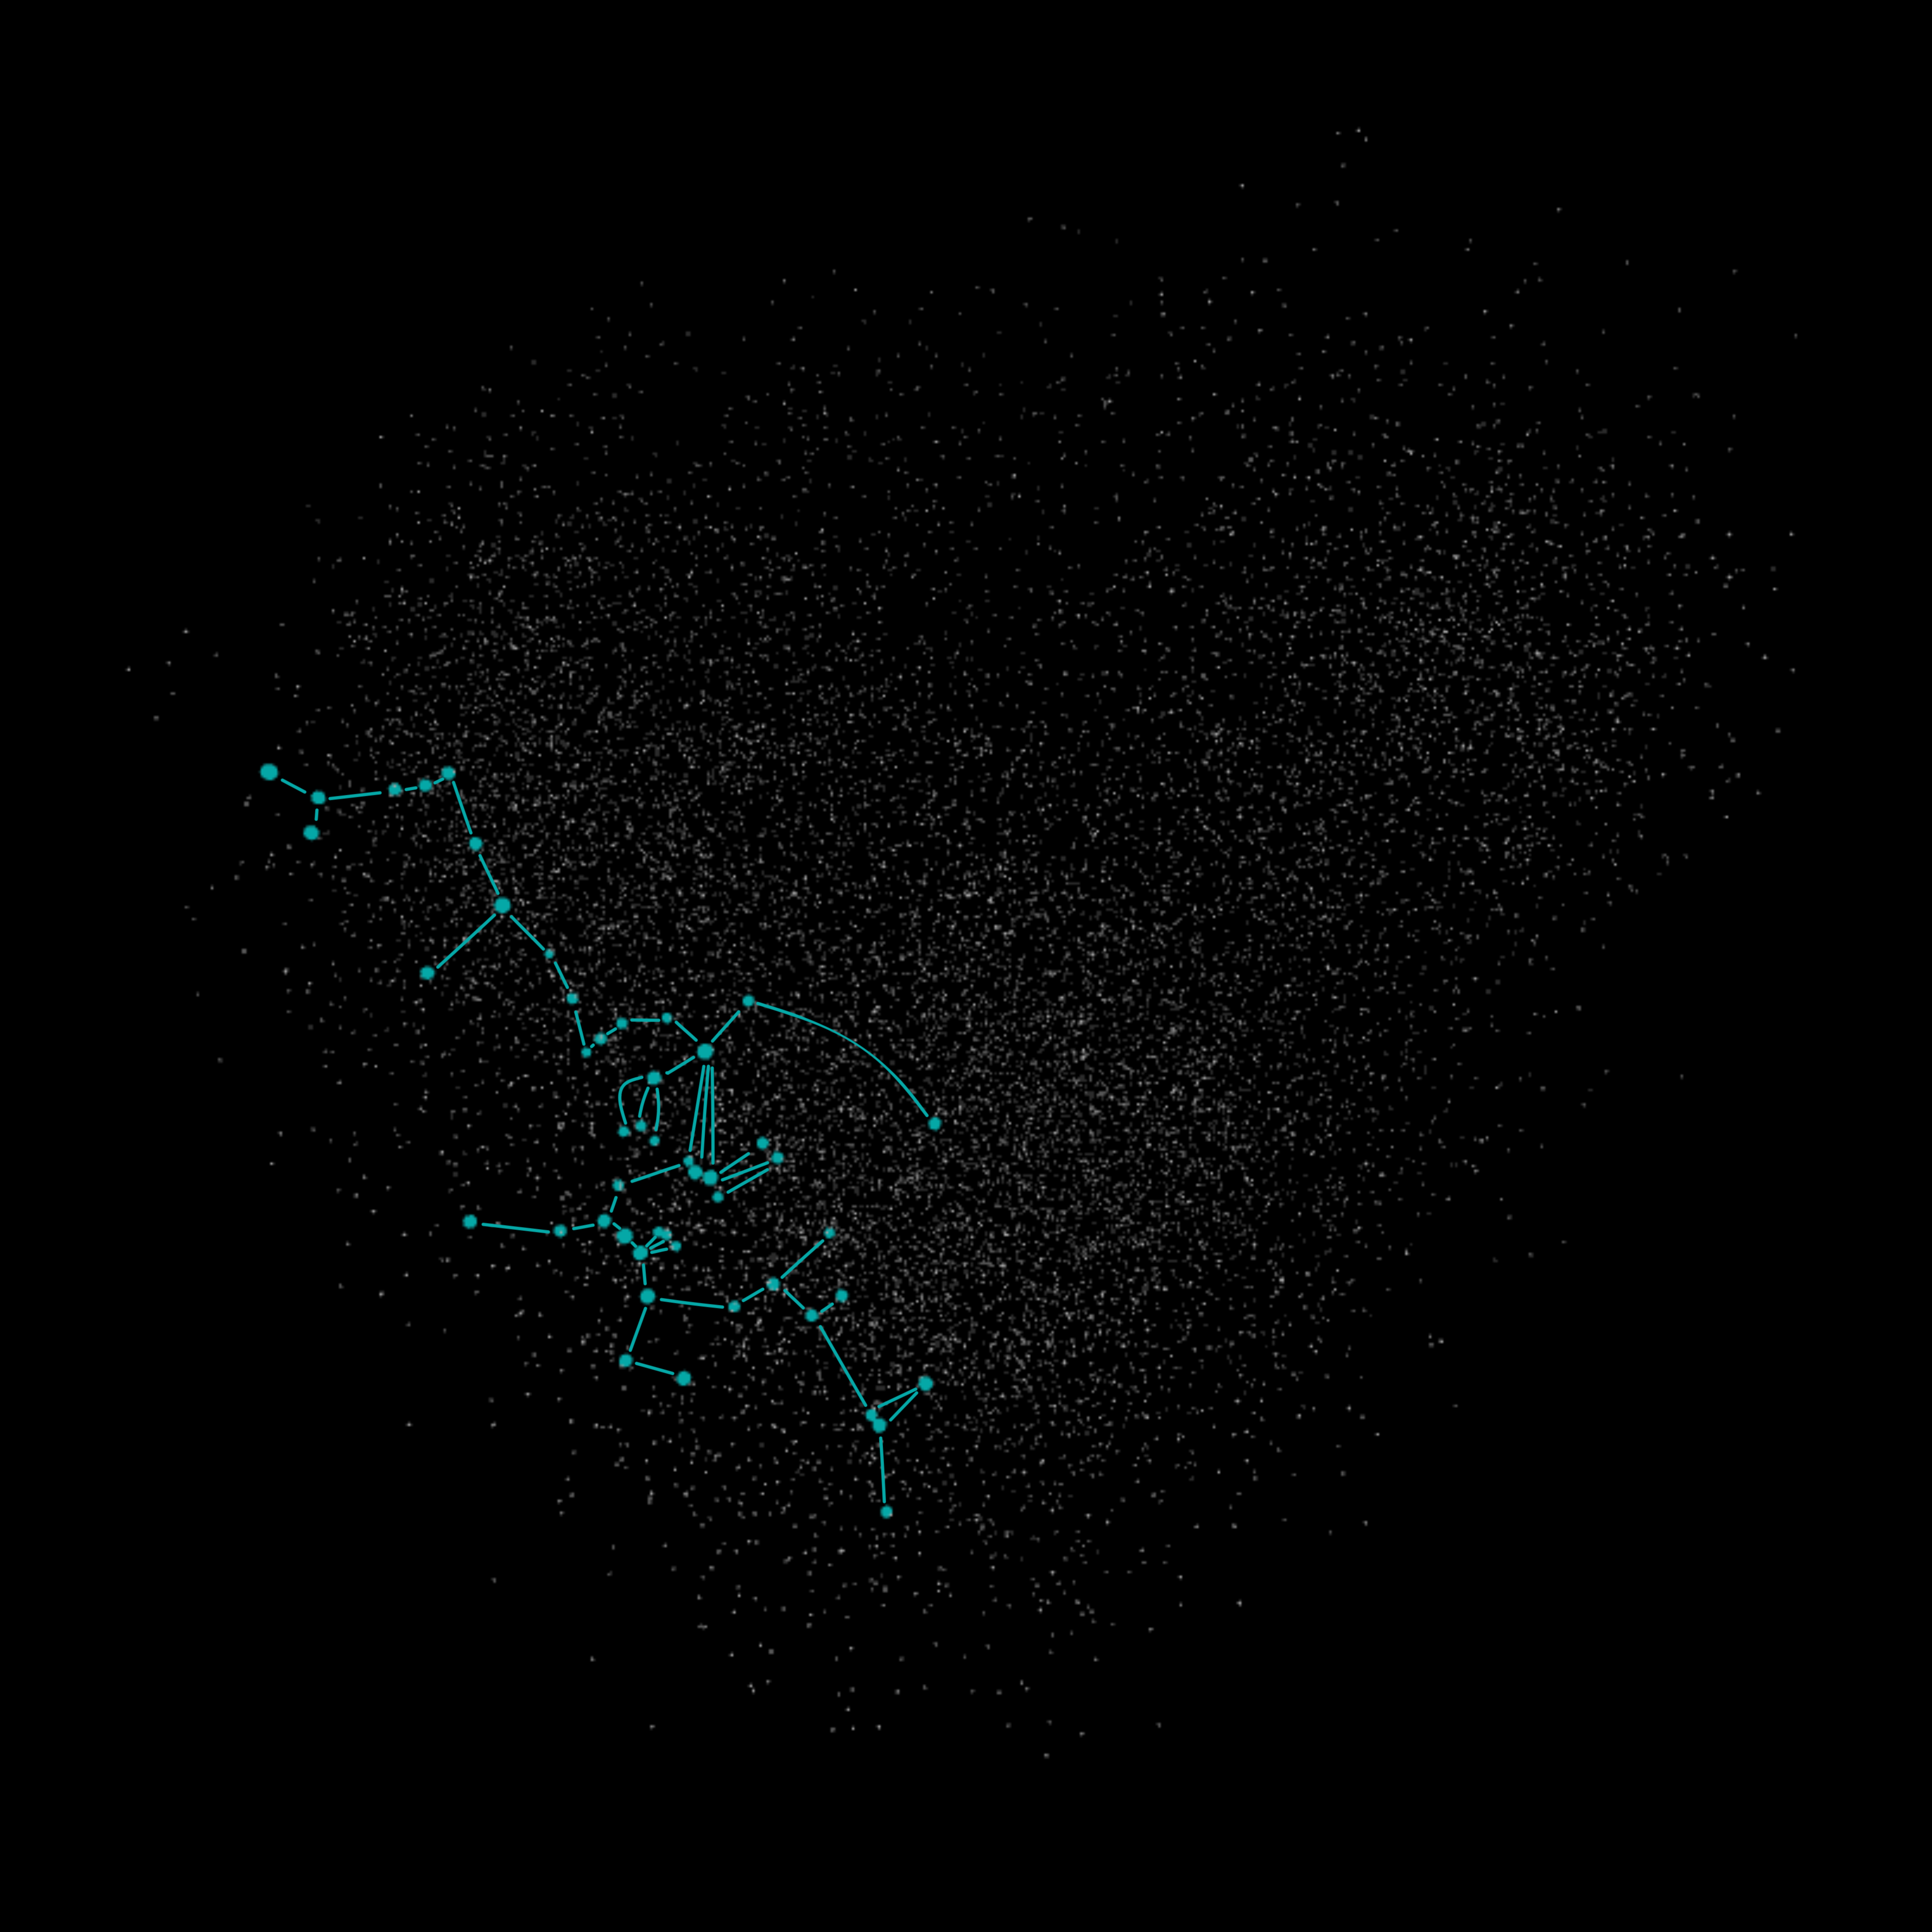
Navigating this rich, multi-dimensional data space builds our intuition of higher-dimensional spaces by learning how these points are interconnected. Every inquiry lights up pathways, enhancing our understanding, as if we were mapping the neural pathways of thought or charting the branching veins of a leaf. This exploration is not just about observing—it's about engaging with the data and witnessing the unfolding narratives, the same way stories come to life under the starlit sky or where a river nurtures the landscape through which it flows.
The transformation from high-dimensional spaces to three-dimensional projections is not without its challenges, yet it is a journey from complexity to comprehensibility. Techniques such as Principal Component Analysis (PCA) and t-Distributed Stochastic Neighbor Embedding (t-SNE) serve as our guides, helping to navigate the trade-offs involved in this process. They ensure that we do not lose the critical nuances of the data, maintaining a faithful representation of the original space.
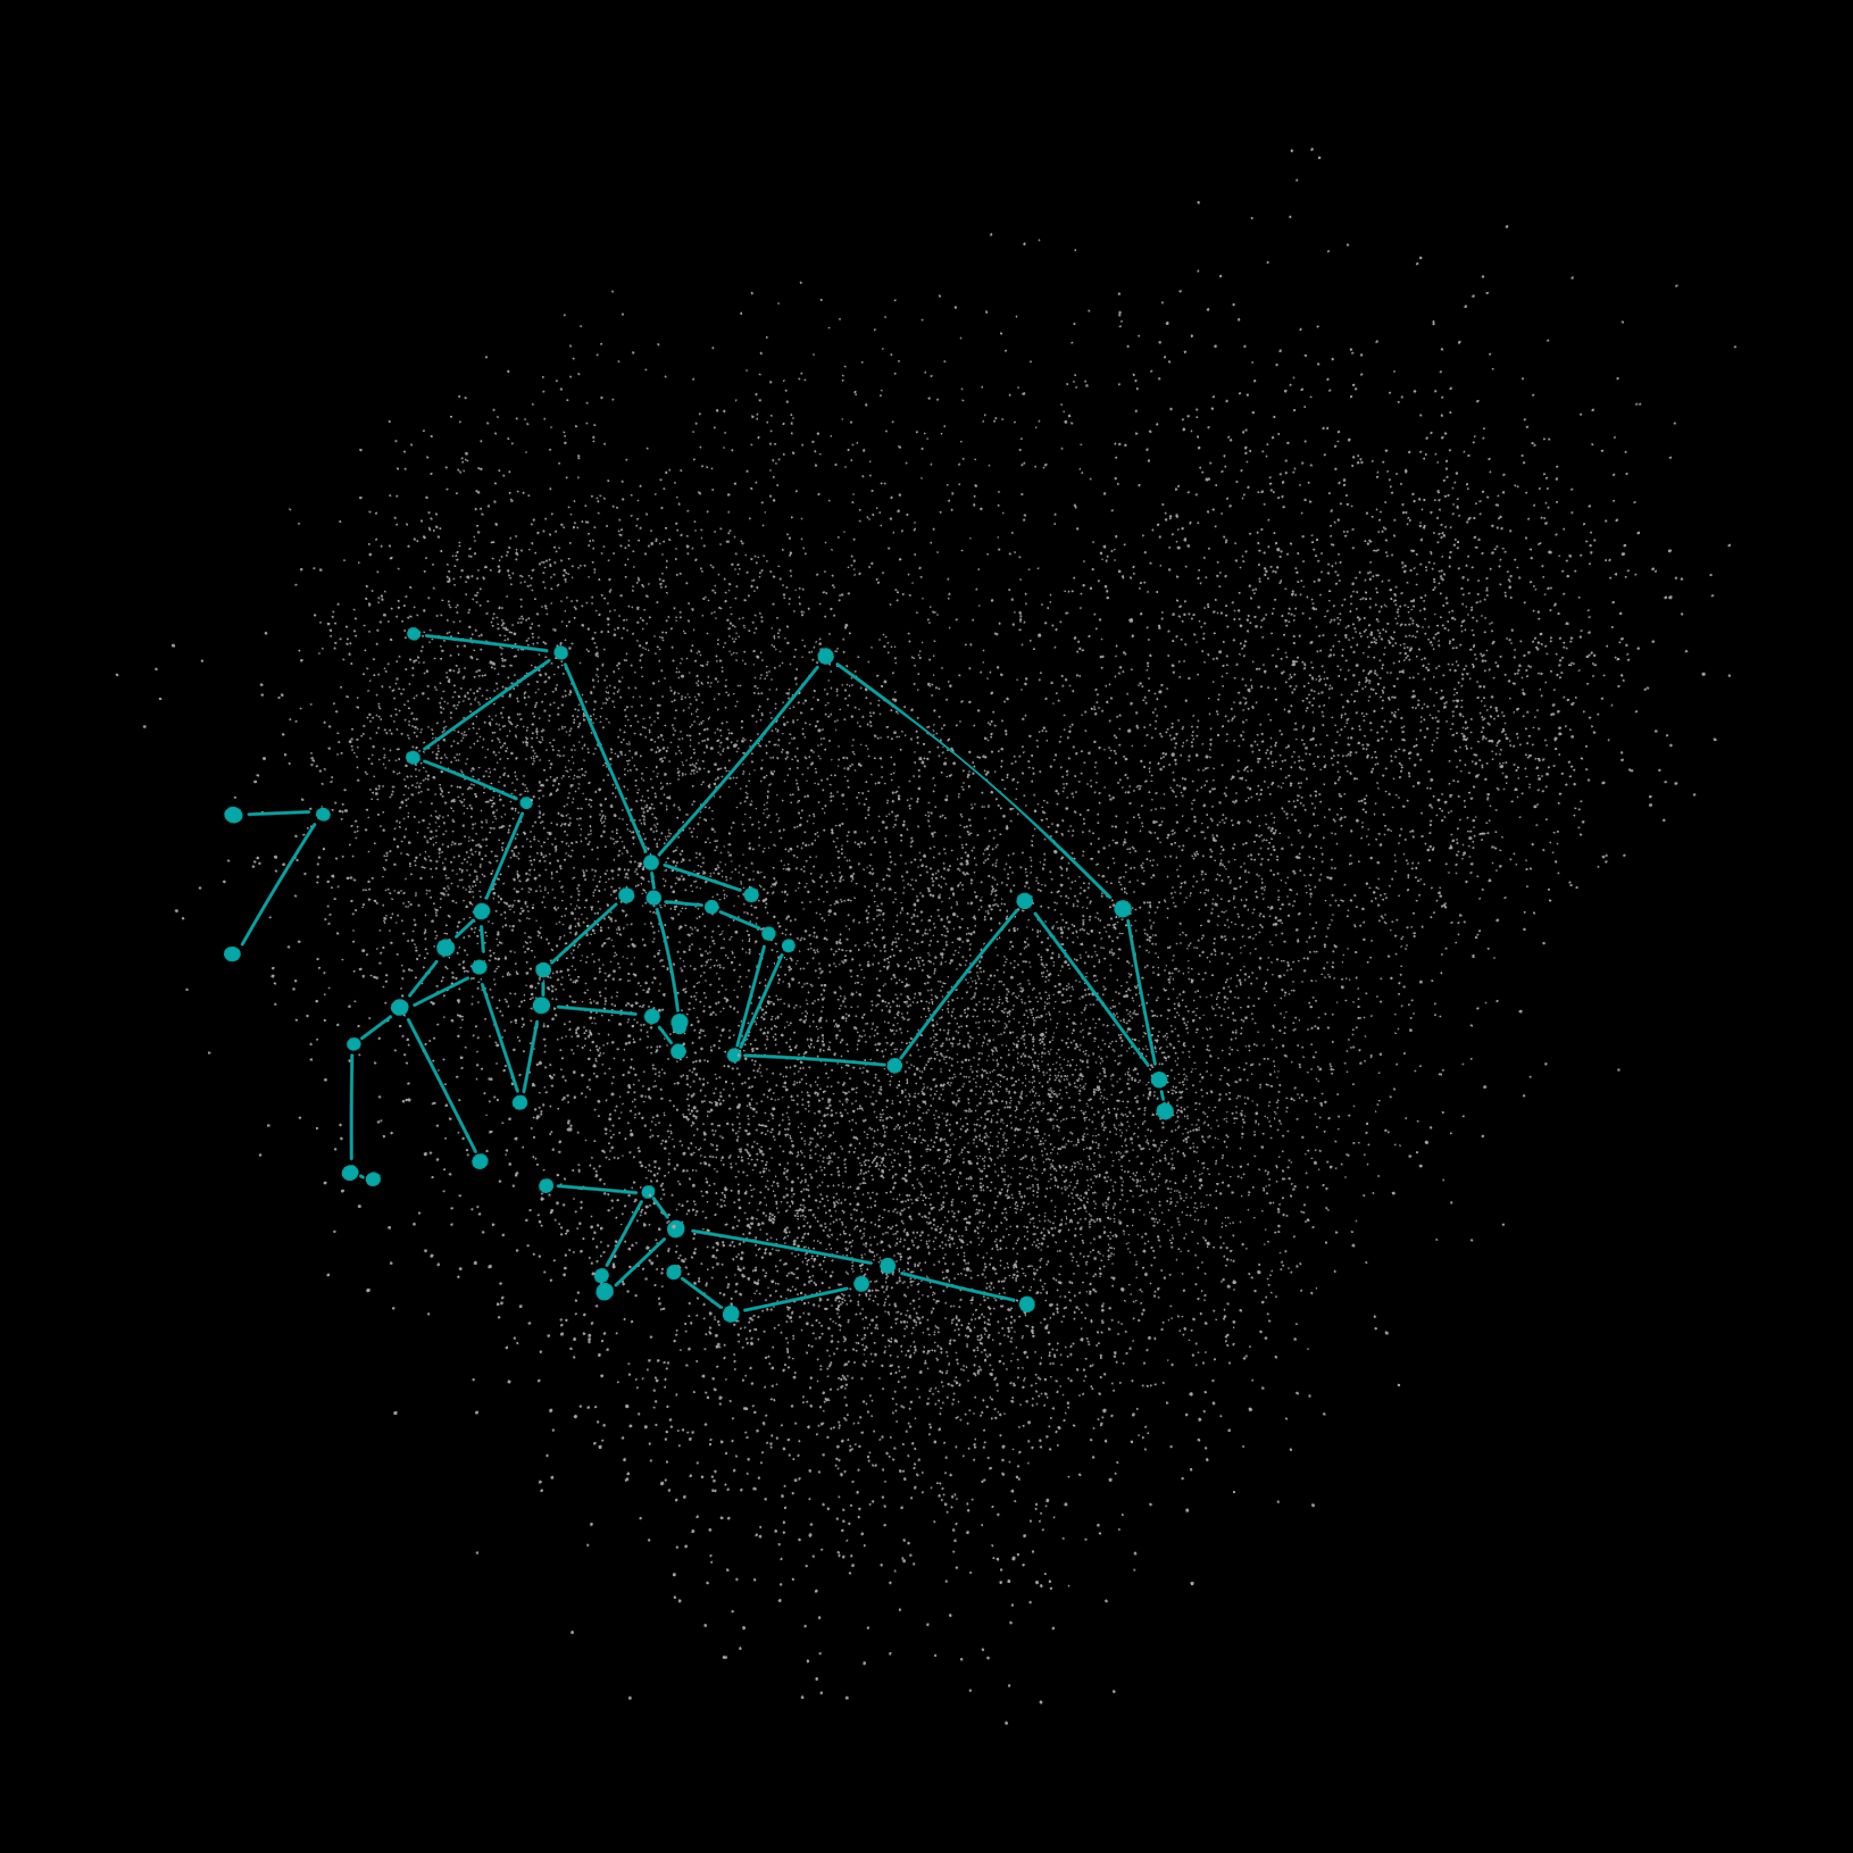
As we engage with these three-dimensional projections, we bridge the gap between the abstract realm of high-dimensional data and the tangible realm of human experience. It becomes a harmonious blend of analysis and intuition, where we see not just constellations of stars but also the sprouting of ideas and insights where the river of data flows, nurturing the seeds of knowledge and understanding in its wake.
IX. The Role of Human-AI Collaboration
This section of our narrative delves into the transformative impact of the synergy between humans and artificial intelligence in the realm of data interpretation. This collaboration plays a pivotal role in breaking down the barriers of complexity and specialized knowledge, bringing intricate information within the reach of a broader audience. By transforming complex data sets into intuitive visual landscapes, AI democratizes the process of data interpretation. This democratization enables individuals from various backgrounds and expertise levels to engage with and derive insights from complex data, thus universalizing access to critical information.
This approach has profound implications for decision-making across various sectors, including business, research, and public policy. By making data more accessible and comprehensible, it empowers a more diverse range of people to participate in informed decision-making processes. This inclusive approach bridges the knowledge gap between data scientists and laypeople, fostering a more informed public discourse and allowing individuals to contribute meaningfully to data-driven discussions.
The educational and practical implications of this accessibility are significant. It fosters a culture of learning and curiosity, encouraging more people to explore data-driven fields and apply these insights in various aspects of their lives. This shift towards a more data-literate society has far-reaching impacts, extending beyond professional fields into everyday life.
A crucial aspect of this human-AI collaboration is the transfer of expert knowledge to non-experts. AI-generated visual landscapes encapsulate complex concepts in an intuitive format, making expert-level understanding more accessible to a wider audience. These landscapes facilitate intuitive learning and understanding, aligning with natural human cognitive processes and allowing users to 'see' and 'feel' the data. This leads to a deeper, more instinctive grasp of complex subjects.
AI also acts as a cognitive extension, augmenting human capabilities and enabling users to process and understand information at a level that would be unattainable through traditional means. This extension of cognitive reach is further enhanced by AI systems that can tailor the learning experience to individual users, adapting to their level of understanding and interest. This personalized approach not only accelerates the learning curve but also deepens users' engagement with the data.
By making expert knowledge more accessible and understandable, these systems foster a culture of continuous learning and curiosity. They encourage individuals to explore beyond their areas of expertise and to develop a broader understanding of the world around them. This ongoing learning process is pivotal in building a society that is not only more informed and engaged but also continuously evolving in its understanding and application of data.
In essence, the "Role of Human-AI Collaboration" section underscores the significant impact of AI in democratizing data interpretation and enhancing human cognitive abilities. This collaboration transforms complex information into accessible knowledge, fostering a more informed, engaged, and continuously learning society.
X. Enhancing AI Training with a Holistic Approach to Data
Our final section addresses the critical importance of nurturing a sustainable data ecosystem for the effective training of AI systems. At the core of this ecosystem are ethical foundations that prioritize responsible data sourcing, privacy, and the integrity of information. These ethical practices are instrumental in establishing trust and reliability in AI systems, ensuring that they serve as dependable tools for data analysis and interpretation.
Strategic data stewardship plays a crucial role in maintaining a healthy AI ecosystem. This involves the meticulous curation of data, continuous assessment of its relevance, and the proactive removal of outdated or biased information. Such stewardship is vital to prevent the propagation of inaccuracies or stereotypes, ensuring that the AI systems are informed by current and unbiased data.
The concept of sustainability in AI draws a parallel to environmental stewardship. Just as natural ecosystems require balance, diversity, and sustainability, so too do AI ecosystems thrive on a diverse mix of data types, sources, and methodologies. This diversity ensures a rich and healthy data environment, fostering the growth and effectiveness of AI systems.
A long-term vision is essential for the health and utility of AI ecosystems. Decisions regarding data collection, processing, and usage are made with a view to their future impact, reflecting sustainable practices akin to those in environmental management. This forward-thinking approach ensures that AI systems remain relevant and beneficial over the long term.
Responsive and adaptive systems are a hallmark of this approach. AI systems are designed to evolve with the changing landscapes of data and user needs, maintaining their relevance and effectiveness in a rapidly evolving digital world.
In cultivating collective intelligence, a holistic approach to data creation and AI training is employed. This approach leverages a diversity of data sources, enriching the AI's learning and enabling it to provide more comprehensive and balanced perspectives. The strength of AI systems, much like that of natural ecosystems, is enhanced by the diversity of data, which includes various types of structured and unstructured information, each contributing unique insights and perspectives.
Synergistic learning models are at the heart of this holistic training environment. Different data sets inform and enhance each other, leading to the development of more robust and intelligent AI systems. Community and collaboration are emphasized, encouraging the sharing of data and insights across disciplines and sectors. This collaborative environment fosters an ecosystem where collective intelligence is harnessed, leading to more innovative solutions and discoveries.
An ethical approach to AI development is paramount, ensuring that a wide range of inputs is considered in AI training. This diversity of inputs is crucial in building AI systems that are fair, unbiased, and representative of the diverse world they serve. By prioritizing ethical practices and diverse inputs, AI systems are less likely to develop biases, thereby enhancing their fairness and utility.
In summary, the "Enhancing AI Training with a Holistic Approach to Data" section underscores the importance of ethical, sustainable, and diverse practices in the management and training of AI. It highlights how a holistic approach, inspired by the principles of natural ecosystems, can lead to the creation of AI systems that are not only more robust and intelligent but also ethically responsible. This approach enhances the capabilities of AI, ensuring its relevance and effectiveness in a rapidly evolving world.
XI. Conclusion
As we conclude our exploration of the symbiotic relationship between humans and AI in the realm of data navigation, we stand at the threshold of a new epoch in understanding. The journey through the intricacies of embeddings and dimensionality has not merely been about translating high-dimensional data into a visual format; it has been about transforming how we interact with, perceive, and derive meaning from the universe of information that surrounds us.
The convergence of advanced AI techniques and human intuition has paved the way for a democratization of data interpretation, breaking down complex barriers and fostering a culture of inclusivity and continuous learning. Through the visual metaphors of landscapes, neural activity, and celestial patterns, we've seen how data comes to life, telling its stories and revealing its secrets as we traverse its expanse.
The visualizations we've discussed serve as more than just tools; they are bridges connecting disparate islands of knowledge, encouraging interdisciplinary insights, and facilitating a collective intelligence that is far greater than the sum of its parts. As we harness these technologies and insights, we bolster our capabilities to make informed decisions, spark innovation, and drive progress.
In the grand tapestry of data that we've learned to navigate, we find not just patterns but narratives that resonate with our innate cognitive abilities. Like constellations guiding ancient navigators, these narratives guide us towards deeper understanding and wisdom. And as the river of data flows, it nourishes the seeds of knowledge, allowing new ideas to sprout and flourish in the fertile ground of our collective consciousness.
This is the promise and potential of the collaboration between human intuition and artificial intelligence. As we move forward, let us carry with us the lessons learned from this symbiotic dance of human curiosity and AI's computational power. Let us continue to build upon this foundation, ensuring that the future of data navigation is not only intuitive and accessible but also ethical, equitable, and endlessly enlightening. This is not the end of our journey but a new beginning, a launchpad for endless discovery in an ever-expanding universe of data.